Closing Straits: How the Hormuz and Bab el-Mandeb shocks repriced oil, gas, metals and gold
The 2026 crisis and 38 strait events since 2018: oil, gas, metals, gold and Turkey. With satellite radar, gas flares seen from space, a news archive and trade data.
ships in the Hormuz corridor, first closure (satellite radar; −81% in the second)
−84%
detected flare power at Iraq's southern fields, first closure (NASA FIRMS, VIIRS)
+94%
physical Brent, 27 February-7 April; two years forward only +13%
−17.7%
gold per ounce, 27 February-15 September; −9.0% in lira
After the data cut-off (23 September-1 October 2026)
The analyses use data to 22-24 September. This section summarises verified developments in the last days before publication; September data will enter the analyses in the next update.
Diplomacy. Trump rejected the seven-day roadmap Iran presented on 25 September; the US sent a counterproposal through Qatar, and Iran says the dispute is over the sequencing of steps (30 September). Trump said operations could resume after the midterms if there is no deal (1 October).
Strait. UKMTO reported three tankers, one an LNG carrier, struck by unknown projectiles in the strait on 29 September; no casualties. The closure continues.
Iraq. The Oil Ministry put September exports at 2.6 million barrels a day (22 September); SOMO is offering discounts of $26.50 and $28 a barrel on Basrah Medium and Heavy (Al Jazeera, 28 September). Chapter 1 shows that public AIS-based estimates did not reflect the August recovery.
Turkey. TurkStat put energy imports at $6.46 billion in August, up 33.8% year on year, and up 10.2% in January-August (30 September; Chapter 8). Since 16 September Iraq has trucked Basra crude to Kirkuk; about 250,000 barrels a day leave through Ceyhan (24 September).
Prices. Front-month Brent was $103.5 on 30 September (22 September: $99.2); gold was $4,187 an ounce and TRY 6,597 a gram (22 September: $4,376 and TRY 6,867). Closing prices from Yahoo Finance.
Executive summary
The Strait of Hormuz closed twice in 2026. We measured the closures from space in two ways. In Sentinel-1 radar images, the number of ships in the Hormuz transit corridor fell 80% in the first closure and 81% in the second. In NASA FIRMS night-time VIIRS data, detected flare power at Iraq's southern fields fell 84% in the first closure, while in the north, tied to the Kirkuk-Ceyhan pipeline that bypasses the strait, it did not fall. In prices, Brent loading in 10-30 days rose 94% between 27 February and 7 April, while Brent for delivery in two years rose 13%. The report asks where that gap came from and how the shock reached gas, metals, gold and Turkey, drawing also on 38 strait events since 2018, a news archive of 1.4 billion records and Turkey's trade data.
Hormuz emptied; outside the strait, ships piled up. In Sentinel-1 radar images the number of ships in the Hormuz corridor fell 80% in the first closure and 81% in the second (Poisson model; 407 images at five locations). In the second closure, ship numbers off Fujairah, outside the strait, rose 46%.
Flares: down in Iraq's south, not in the north. Detected flare power at Iraq's southern fields fell 84% in the first closure (NASA FIRMS, VIIRS); daily exports from Basra fell from 3.33 million barrels to 79 thousand (SOMO). Flare power is not a measure of output.
Southern Iraq flared far more in the second closure. In the Hormuz corridor the difference between the closures is uncertain (−4%; interval −50% to +85%). Detected flare power in southern Iraq, by contrast, was about four times as high in the second closure as in the first; this is not a measure of output.
Iraq's exports recovered; public AIS estimates did not show it. Iraqi officials put Iraq's exports up 73% from July to August; Kpler and Vortexa estimate August at 2.2-2.3 million barrels a day. IMF PortWatch's estimate of loadings at the Basra terminal halved; its estimate of tanker cargo through the strait was a twentieth of SOMO's Basra loadings.
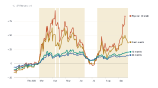
The crisis played out on the forward curve. Between 27 February and 7 April, Brent loading in 10-30 days rose 94% and Brent for delivery in two years rose 13%. The first ceasefire, on 8 April, erased a third of the front-month war premium within two days, but only 7% of it at 24 months.
Signals on the war's duration set the price. Six of the 12 largest daily Brent moves of 2026 were falls, and all six came on ceasefire or peace news.
With Hormuz shut, Bab el-Mandeb became a volume chokepoint. EIA data show oil flows through Bab el-Mandeb rising from 5.4 million barrels a day in the fourth quarter of 2025 to 8.1 million in the second quarter of 2026.
Gold offered no protection in this war. Between 27 February and 15 September gold lost 17.7% in dollars and gram gold 9.0% in lira. Real yields and the dollar explain 23% to 60% of the fall, depending on which period the coefficients come from.
In aluminium, the shortage moved from the exchange to premiums. LME stocks fell to half their pre-war level; in the second closure, regional premiums accounted for more than half of the rise in delivered prices in Europe and Japan.
Half of Turkey's primary aluminium imports arrive by sea from the Gulf and Asia. In 2025, 27% came by sea from the Gulf and 23% by sea from Asia; the 11% from Iran came by road. The classification is by origin and mode of transport.
1 · Measured from space: 80% fewer ships at Hormuz, 84% less flare power in southern Iraq
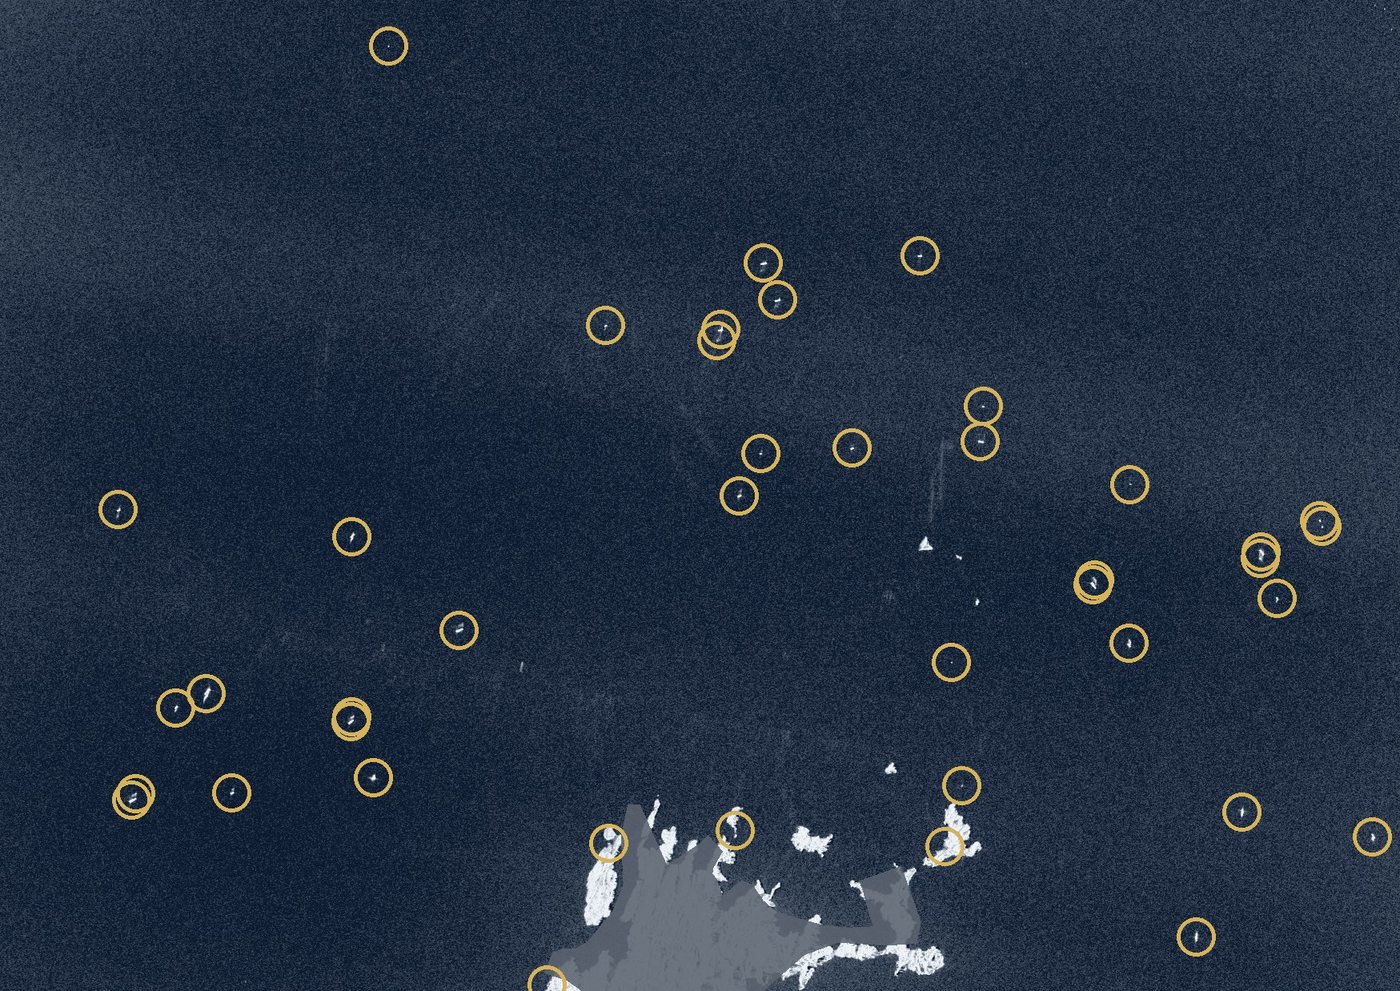
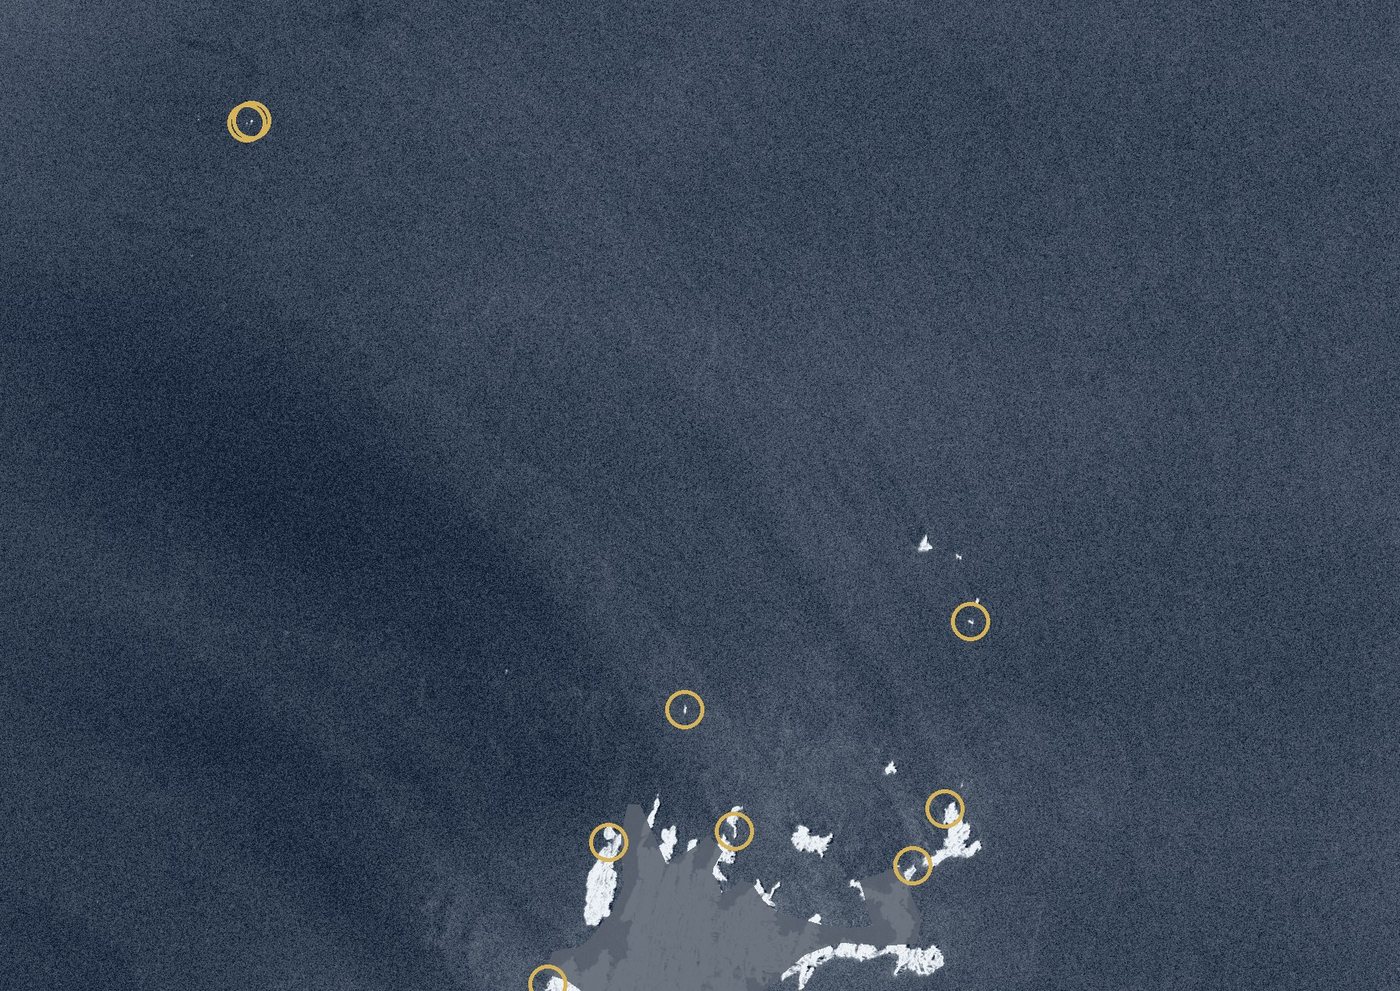
Transit data based on AIS depend on the identification signal that ships broadcast themselves. In a radar image, a ship shows up as a bright spot on the dark sea surface whether or not it is transmitting. We counted ships automatically in every Sentinel-1 image of the Hormuz transit corridor taken since July 2025. The median per image was 40.5 ships before the war, 10 in the first closure and 9.5 in the second. In a Poisson count model that allows for the measurement difference between satellites, the number of ships fell 80% in the first closure and 81% in the second. AIS-based transit counts fell 93%, and EIA data put the volume loss at 77%. The three series measure different things over different periods, so we cannot turn the gaps into lost AIS signals or volumes. Using the same satellites, Cao et al. (2026, The Innovation) found a 97% fall in the strait's main shipping channel in the first week of the closure; our count covers 14 months and both closures. Our working paper sets out the method; code and data are open on Zenodo and GitHub.
41 ships · 30 November 2025, before the war
9 ships · 21 September 2026, second closure
Hormuz transit corridor, about 70 x 50 km (Musandam to Larak Island). Sentinel-1C radar image, 40 m; yellow rings mark the ships counted. On each day the ship count was the closest to its period's median, so each is a typical day. Sentinel-1 RTC: Microsoft Planetary Computer, CC BY 4.0.
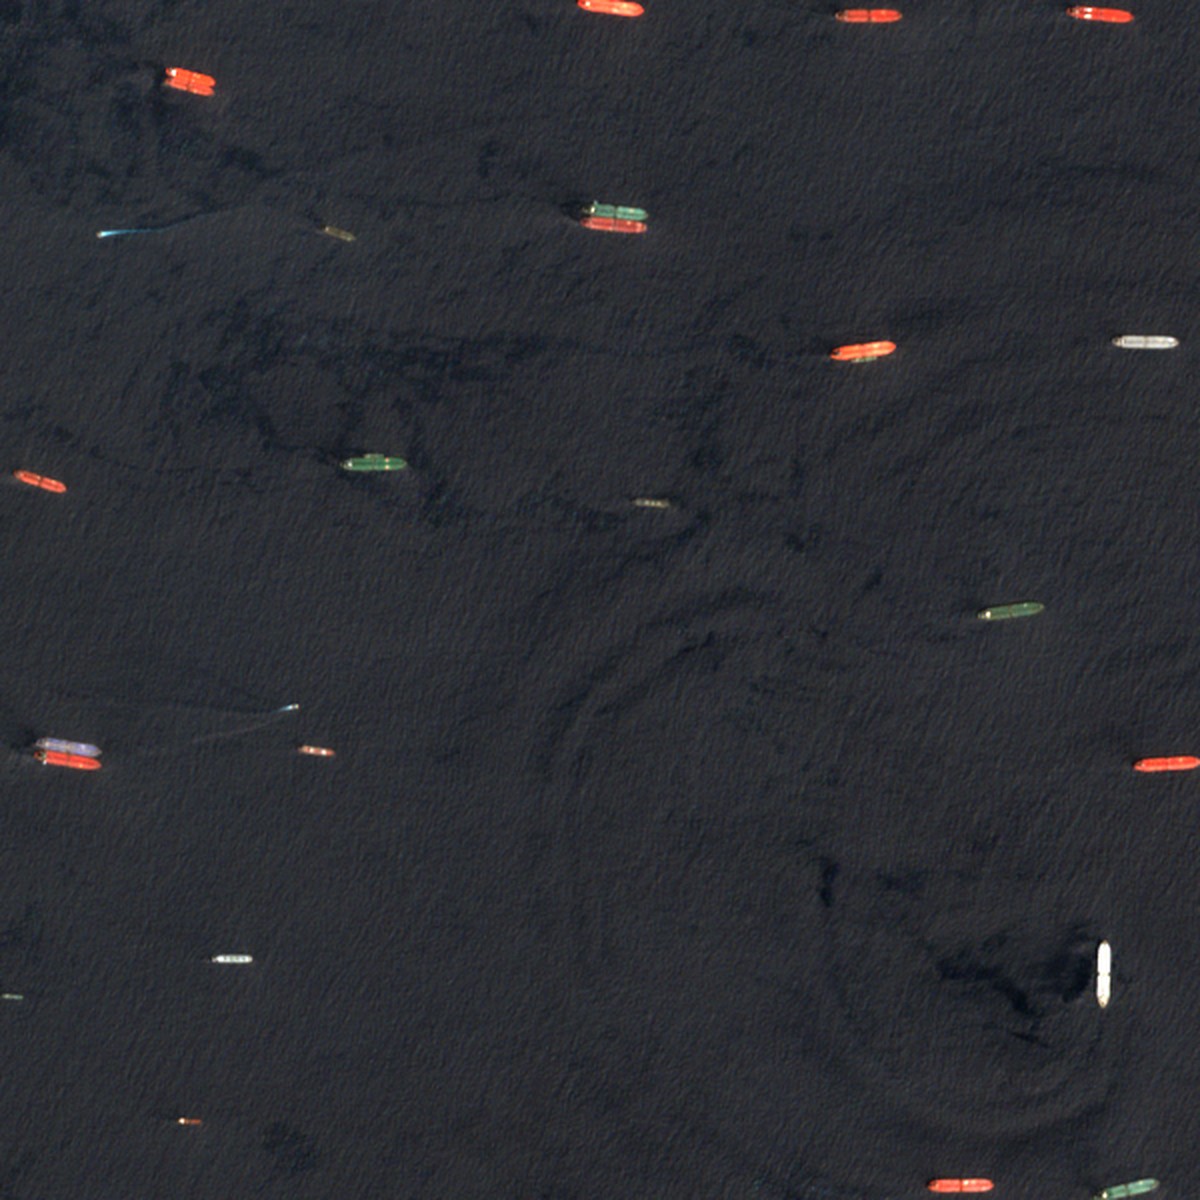
We ran the same count at four other points. Off Ras Tanura, inside the Gulf, ship numbers showed no significant change. At the Fujairah anchorage, outside the strait, the count rose 46% in the second closure. At Yanbu on the Red Sea it rose 32%, but this estimate rests on only 6 images from the second closure and is not significant after correction for multiple comparisons (Holm). At Bab el-Mandeb the count barely changed in the first closure (+6%), and the second-closure rise (+22%) is not significant either. Neither Fujairah nor Yanbu saw a clear rise in the first closure. The pattern points to ships inside the Gulf staying put while those outside waited off the strait.
Figure 1 · Report Figure 1.3
The Hormuz corridor emptied; Fujairah, outside the strait, filled up
Source: Sentinel-1 RTC (Microsoft Planetary Computer, CC BY 4.0); MetalTakip count. Monthly median; at each location the pre-war (July 2025-February 2026) median = 100. Sentinel-1C and 1D images only: in Sentinel-1A images the sea surface is brighter and fewer ships are counted; the mechanism has not been established. Ship type is not identified; the count measures ships present when the image was taken.
Off Fujairah, 30 August 2026, 6 x 6 km close-up: each coloured streak is a ship. Contains modified Copernicus Sentinel data 2026.
Flares seen from space: down in Iraq's south, not in the north
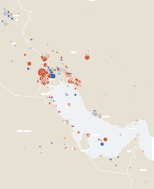
Gas that comes up with oil and cannot be processed is burned at the fields. These flares appear as hot spots in night-time images from the VIIRS sensor (on the NOAA-21 and Suomi NPP satellites; data from NASA FIRMS) and usually shrink when output is cut. From detections over 751 nights across the Gulf, Iraq, Iran and Oman, we isolated the flare sites that burned regularly before the war and summed the radiative power detected at them each night. At Iraq's southern fields, detected flare power fell 84% in the first closure (95% confidence interval −88% to −79%); the estimate from a second satellite is −86%. Using VIIRS Nightfire data, the Payne Institute also found a sharp fall around Basra in the first ten days of March (Zhizhin and Bazilian, 2026). According to SOMO, Iraq's oil marketing company, daily exports from Basra fell from 3.33 million barrels in February to 79 thousand in May.
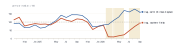
In the north, tied to the Kirkuk-Ceyhan pipeline that bypasses the strait, flare power did not fall; it rose 23% (second satellite +14%, not significant). Daily northern exports to Ceyhan (Kirkuk and Kurdistan Region crude) were 198 thousand barrels in February and 168 thousand in May. Compared in one model, flare power in the south fell 87% relative to the north. Cloud leaves the southern result intact and shrinks the northern rise: on nights when at least 90% of the sites were seen in clear sky, the fall in the south is 83% to 85% and the rise in the north 13% to 14%. This is still a comparison of periods; it does not separate war damage from production decisions. In the second closure, Basra exports rose to 2.25 million barrels a day according to SOMO's August report, and detected flare power in the south partly recovered.
Figure 2 · Report Figure 1.5
Gulf flares: the biggest fall was at Iraq's southern fields
Source: NASA FIRMS (VIIRS 375 m, NOAA-21, night passes); MetalTakip calculations. Colour: change in detected flare power per night in the first closure (2 March-13 June 2026) against the same days of 2025; dark terracotta a fall of more than 60%, light terracotta a fall of 20-60%, grey a change of less than 20%, light blue a rise of 20-60%, dark blue a rise of more than 60%. Dot size: pre-war flare power.
Figure 3 · Report Figure 1.6
In Iraq, flares followed the export route
Source: NASA FIRMS; MetalTakip calculations. Radiative power detected per night at persistent flare sites, monthly median; pre-war (September 2024-February 2026) median = 100. South: Basra, Maysan, Dhi Qar; north: Kirkuk and the Kurdistan Region.
In Bahrain, detected flare power fell 78% in the first closure. The smaller fall in Qatar is not robust: it loses significance after correction for multiple comparisons and on the second satellite. On all 13 nights without any detection, most sites were under cloud; on clear nights the change was −15% to −19% and not significant. Saudi Arabia and Oman, which have routes around the strait, showed no significant fall on either satellite in the first closure. Detected flare power does not move one for one with output: in the UAE it rose 304% in the first closure and 201% in the second, and Kuwait saw no fall in the first. A plant that can still ship crude by pipeline but cannot sell its gas may burn it; we did not test this explanation.
Two closures: few ships in both, flaring diverged
In the Hormuz corridor, radar counted about a fifth of the pre-war number of ships in both closures. The difference between the closures is uncertain: in the same model the second differs from the first by −4%, with a 95% confidence interval from −50% to +85% (p = 0.91); nor does this show that they were equal. On land, detected flare power in southern Iraq was about four times as high in the second closure as in the first (+315% and +329% in two cloud-controlled models); this does not mean output quadrupled. Basra's daily exports rose from 79 thousand barrels in May to 2.25 million in August.
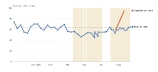
By sea, this oil can leave the Gulf only through Hormuz. Iraq's total exports were also recovering: two Iraqi energy officials put them at 1.35 million barrels a day in July and 2.34 million in August, and the ship-tracking firms Vortexa and Kpler estimated Iraq's August exports at 2.30 and 2.17 million (Reuters, 2 September 2026). Cargoes went to China and India, and Iran reportedly let some Iraqi tankers through. The recovery did not show up in estimates based on public AIS data: IMF PortWatch estimated loadings at the Basrah Oil Terminal at 0.60 million barrels a day in July and 0.30 million in August, 13% of SOMO's loadings in August (49-85% a month before the war), and its estimate of tanker cargo through the strait came to a twentieth. These ratios compare two estimates; they are not the share of Basra's oil seen on AIS. Lloyd's List Intelligence counted at least 112 non-Iranian-linked crude tanker transits in August (at least 72 in July), while all tanker transits in both directions in PortWatch fell from 148 to 58. Two indicators with different scopes moving in opposite directions is a serious monitoring mismatch; these aggregates cannot separate the roles of AIS coverage, detection, cargo estimation and ships switching off their transponders. Radar counts off Basra showed no lasting rise over the whole second closure; a temporary rise within August on the descending orbit (+12.8 ships per 30 days; cautious interval −6.0 to +31.5) cannot be ruled out. Ship numbers are not cargo inventories.
Figure 4 · Report Figure 1.8
Ship numbers off Basra did not rise lastingly
Source: Sentinel-1 RTC (Microsoft Planetary Computer, CC BY 4.0); SOMO; MetalTakip count. Ascending orbit, Sentinel-1C and 1D only. Dashed horizontal line: pre-war median. The dashed red line is a hypothetical scale, not an observed inventory or a forecast: the ships added if every 2 million barrels of the August loadings (2.25 million barrels a day) had stayed in the box on a separate VLCC; spare capacity in the box and departures are not modelled.
2 · Anatomy of the shock
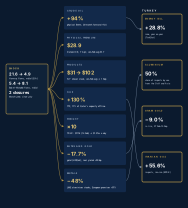
The closure of Hormuz reached prices through seven channels: crude oil; the physical premium; refined products; gas; freight; interest rates and gold; metals. It reached Turkey in four ways: the energy bill, aluminium supply, gram gold and Iranian gas.
Figure 5 · Report: Anatomy of the shock
Seven transmission channels and four effects on Turkey
Source: EIA, IEA, QatarEnergy, Baltic Exchange, LME, CME, ICE, LBMA, TurkStat, EPDK, UN Comtrade; MetalTakip calculations. Changes are measured from 27 February 2026 unless another period is given.
3 · Oil: the crisis played out on the forward curve
In the first five weeks of the war, physical Brent, a cargo loading in 10-30 days, rose from $71 to $138 a barrel. Over the same days, oil for delivery in two years went from $66 to $74. The forward curve shows that the market took the closure seriously but did not treat it as permanent: the rise was concentrated at the front. When the strait reopened in June, spot fell 4% below its pre-war level, while the 24-month price stayed 5.5% higher even at its low. In the short war of 2025, the same maturity had returned to its starting point on the day of the ceasefire.
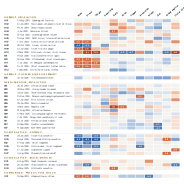
Escalation and ceasefire were priced at different speeds. In the 2026 escalation events Brent rose 3.9% on average over the first two days and kept rising for two weeks; ceasefire news brought the price down in a single day. In an event study of 39 events since 2018 (38 strait events plus the 2019 Abqaiq attack, for comparison), de-escalation in Hormuz moved Brent about twice as much as escalation. With so few events the ratio itself is uncertain; what can be said with confidence is the difference in rhythm.
Figure 7 · Report Figure 1.10
Which shock moved what?
Source: MetalTakip event study. Cells with numbers are significant at about the 5% level (|z| ≥ 1.96). Red: rise; blue: fall.
4 · Hormuz and Bab el-Mandeb: two straits, two roles
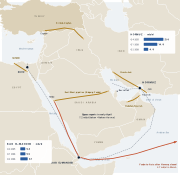
According to the EIA, oil flows through Hormuz fell from 21.6 to 4.9 million barrels a day in two quarters. Exports through the Gulf's bypass pipelines reached 7.2 million barrels a day in early April (IEA). In normal times a disruption at Bab el-Mandeb only lengthens the Asia-Europe route; with Hormuz closed, it became the gate that Saudi oil shipped from Yanbu to Asia had to pass. EIA data show oil flows through Bab el-Mandeb rising from 5.4 million barrels a day in the fourth quarter of 2025 to 8.1 million in the second quarter of 2026. After the East-West pipeline was shut in September, physical Brent climbed back above $130, which points to that dependence.
Figure 8 · Report Figure 1.9
With Hormuz closed, Gulf oil turned to the Red Sea
Source: EIA (strait flows), IEA Oil Market Report April 2026, Natural Earth. Pipeline routes are schematic.
5 · Why gold offered no protection in the 2026 Hormuz crisis
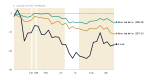
Gold lost 17.7% in dollar terms between 27 February and 15 September. Of the roughly 100 basis point rise in the US 10-year yield, 90 basis points came from real yields; breakeven inflation barely moved. The market priced a tightening Fed more than oil-driven inflation. Real yields and the dollar explain 23% to 60% of the fall, depending on which period the coefficients come from. The net long of futures funds shrank slightly until late April and then grew; in the model, funds are not the component that explains the fall. North American gold funds and the official institutions of Turkey, Russia and Azerbaijan stood out on the selling side. China's first-half imports of 764 tonnes, 2.4 times the level a year earlier, did not stop the decline.
Figure 9 · Report Figure 6.1
Real yields and the dollar explain part of the fall
Source: LBMA, US Treasury, ICE; MetalTakip calculations. Weekly regression; coefficients from 2017-2021 and 2023-2025.
Correlations shifted during the war. The correlation between Brent and global equities fell from +0.29 to −0.49, changing sign, while the correlation between gold and equities rose from +0.15 to +0.44. In this crisis oil tended to rise when equities fell, and gold fell with equities. These are correlations: we did not test an implemented hedge with its weights and costs.
6 · Turkey: a weak physical link to Hormuz in oil, a strong one in aluminium
According to EPDK, 47.7% of Turkey's crude imports in 2025 came from Russia and 11.8% from Kazakhstan. The Gulf's share (Iraq 15.8%, Saudi Arabia 7.0%) is just over a fifth, and part of it does not use Hormuz. On price, by contrast, Turkey is exposed to Brent: Russian crude is also priced off Brent, and price rises reach the bill with a lag; the energy import bill in August was 33.8% higher than a year earlier, and 10.2% higher in January-August (TurkStat). The main physical exposure is aluminium. UN Comtrade data show that of Turkey's $4.71 billion of primary aluminium imports in 2025, 27% came by sea from the Gulf and 23% by sea from Asia. The classification rests on origin and mode of transport; it does not track the routes ships actually took.
Figure 10 · Report Figure 8.1
Turkey's primary aluminium imports by origin and mode of transport
Source: UN Comtrade (Turkey as reporter, 2025, HS 760110 and 760120, by value and mode of transport); MetalTakip classification. The classes show route exposure; the routes ships took were not measured.
Gold lost value in lira terms too: gram gold fell 9.0% between 27 February and 15 September. GDELT data show that Turkish-language sources mentioned Hormuz about six times as often as the global press, relative to their total news volume. The ratio was similar before the war (6.1 in 2025): Turkish media interest in Hormuz is structural.
7 · Three scenarios for the 60 trading days after 22 September
The report's simulation asks one question for each of three scenarios for the strait: if this scenario happens, how did prices move over the next 60 trading days in similar past situations? For the first ten days, the reopening scenario uses the realised paths of Hormuz's four reopening or ceasefire announcements (two collapsed within a day), and the escalation scenario those of six events that hit supply directly; the closure-persists scenario has no event stage. Later days are sampled in five-day blocks from the daily moves of the open or closed strait regime that followed each event. This is not a forecast, and no probabilities are attached to the scenarios.
The median Brent price after 60 trading days is $94 with a reopening, $99 if the closure persists and $113 under escalation, where the 80% range is $81-167. Applied to past periods, the realised paths stayed inside the 80% band on 76% of days on average; the method understated the fall that followed the lasting reopening in June.
Brent, three scenarios, 60 trading days (25 seconds).
Start: 22 September, 99 $/bbl. Light band 10-90%, dark band 25-75%, line: median.
Brent: median and 80% range after 20 and 60 trading days
Scenario
After 20 days
After 60 days
Reopening announced
9579-118
9473-131
Closure persists
10081-123
9969-144
Escalation spreads
11588-146
11381-167
Not a forecast; no probabilities are attached to the scenarios. Each scenario combines the first 10 days of similar past events with the daily moves of the regime that followed (open or closed strait); 10,000 paths per scenario. Source: MetalTakip simulation; data from ICE, EIA, LBMA, Yahoo Finance.
8 · Which indicators should be watched in the next shock?
Dated Brent more than $5 above the ICE front month: physical cargoes decouple from futures.
New York diesel crack above $50: product shortage; in this crisis it rose from $31 to $102.
LME aluminium stocks below 300,000 t: low exchange stocks. A European premium above $400 signals scarce delivered metal.
War-risk insurance above 1% of hull value: high war-risk cost.
Hormuz above 5 in every 10,000 news articles: escalation phase (the 2019 and 2025 peaks were 11-14; the 2026 peak was close to 100).
These indicators moved in this crisis. The thresholds are alert levels based on this crisis and the 2019-2025 events; on their own they do not generate trading signals.
9 · Methods and data
Event study. 38 strait events between 2018 and 2026, plus the 2019 Abqaiq attack for comparison. Normal returns come from a constant-mean model estimated over 120 days ending 11 trading days before each event; other events' windows are excluded.
Forward curve. 12- and 24-month constant-maturity Brent, interpolated linearly between CME contracts.
Satellite radar. Sentinel-1 RTC images (Microsoft Planetary Computer), VH polarisation. Fixed bright targets were masked with the median of pre-war scenes; the detection threshold is 9 dB above the sea-surface median. Percentage changes come from a Poisson model with period and satellite dummies and robust standard errors. Ship type is not identified; the count measures ships present, not transits.
Gas flares. NASA FIRMS VIIRS 375 m night detections (main series NOAA-21, second satellite Suomi NPP); radiative power detected per night at sites that burned regularly before the war, modelled with a Poisson (PPML) regression on period and calendar-month dummies. Cloud and coverage were checked with 3,111 NOAA-21 Level-2 granule pairs. Iraq's exports are from SOMO's monthly reports, AIS-based transits from IMF PortWatch.
News data. Indices built by MetalTakip from the GDELT Project's open data on BigQuery.
Verification. We checked 17 claims attributed to other institutions against their primary sources (47 items: 28 confirmed, 3 different, 6 not found, 10 in secondary sources only); differing items were corrected and missing ones removed.
Dağlı, Y. O. and Özpolat, E. (2026). Closing Straits: How the Hormuz and Bab el-Mandeb shocks repriced oil, gas, metals and gold. Chokepoints Series, No. 1. MetalTakip Sector Research, September 2026. https://www.metaltakip.com/en/research/closing-straits
Versions: report September 2026 (first release); working paper 1.6; data and code package 1.4.1. Corrections are announced on this page with their date and the version affected.
How much did oil prices rise when the Strait of Hormuz closed in 2026?
In the first five weeks of the closure (27 February to 7 April), physical Brent loading in 10-30 days rose from $71 to $138 a barrel, or 94%. Brent for delivery in two years rose only 13% over the same period. The forward curve shows that the market took the closure seriously but did not treat it as permanent: the rise was concentrated at the front.
Why did gold lose value during the 2026 Hormuz crisis?
Gold fell 17.7% in dollar terms between 27 February and 15 September. Over the same period the US 10-year real yield rose 90 basis points; the market priced a tightening Fed more than oil-driven inflation. Real yields and the dollar explain 23% to 60% of the fall, depending on the coefficients used. North American gold funds and the official institutions of Turkey, Russia and Azerbaijan stood out on the selling side.
Why did Bab el-Mandeb matter once Hormuz closed?
EIA data show oil flows through Bab el-Mandeb rising from 5.4 million barrels a day in the fourth quarter of 2025 to 8.1 million in the second quarter of 2026. According to the IEA, Saudi Arabia shipped 3.7 million barrels a day from Yanbu to Asia in March, and that oil had to pass Bab el-Mandeb to reach Asia. A strait where a disruption normally only lengthens the voyage became a volume chokepoint.
Where were Turkey's imports most physically exposed to the Hormuz crisis?
In oil the physical link is weak: according to EPDK, 47.7% of Turkey's crude imports in 2025 came from Russia and 11.8% from Kazakhstan. In aluminium, by origin and mode of transport, 27% of primary aluminium imports came by sea from the Gulf and 23% by sea from Asia. On price, Turkey is exposed to Brent: its energy import bill in August was 33.8% higher than a year earlier, and 10.2% higher in January-August (TurkStat).
How was ship traffic in the Strait of Hormuz measured from space, and how far did it fall?
In Sentinel-1 radar images we counted ships in the Hormuz transit corridor: the number fell 80% in the first closure and 81% in the second (Poisson count model). AIS-based transit counts fell 93% and the EIA volume estimate 77%; the three series measure different things over different periods, so the gaps cannot be read as lost AIS signals or volumes. Off Fujairah, outside the strait, ship numbers rose 46% in the second closure.
Do satellite data show that Gulf oil output was cut?
Not directly, but there is a strong trace. In NASA FIRMS night-time VIIRS data, detected flare power at Iraq's southern fields fell 84% in the first closure, while daily exports from Basra dropped from 3.33 million barrels to 79 thousand. In the north, tied to the Kirkuk-Ceyhan pipeline that bypasses the strait, flare power did not fall. Flare power is not a measure of output and does not move one for one with it. Excluding cloudy nights, the fall in the south is still 81% to 85%.
Where did the oil Basra loaded in the second closure go?
Reuters reported that cargoes went to China and India. SOMO says Basra loaded 2.25 million barrels a day in August; for Iraq's total exports, Iraqi officials give 2.34, Vortexa 2.30 and Kpler 2.17 million. The recovery did not show up in public AIS-based estimates: IMF PortWatch's estimates came to 13% of SOMO's loadings at the Basra terminal and a twentieth in the strait. Lloyd's List Intelligence counted at least 112 non-Iranian-linked crude tanker transits that month. These aggregates cannot tell how much of the gap comes from transits missing from AIS and how much from coverage and estimation. Radar counts off Basra showed no lasting rise over the whole second closure.
Where do the report's data come from?
Prices from LBMA, LME, ICE, CME and the EIA; strait flows from the EIA; trade from UN Comtrade, TurkStat and EPDK; news data from the GDELT Project (BigQuery); satellite images from Copernicus Sentinel-1 and Sentinel-2; flare detections from NASA FIRMS; Iraq's exports from SOMO; AIS-based transits from IMF PortWatch. We checked 17 claims attributed to other institutions against their primary sources (47 items: 28 confirmed, 3 different, 6 not found, 10 in secondary sources only); differing items were corrected and missing ones removed. The event study and analyses are MetalTakip's own calculations.
He runs MetalTakip's data pipelines and publishing system. He designed Closing Straits, collected and analysed the data, prepared the visualisations and wrote the first draft, and is the corresponding author.
A statistics graduate of Middle East Technical University, she spent ten years in internal audit and credit monitoring at Akbank. For Closing Straits, she reviewed the data and analysis audits and the methods, and revised the text.
Contributions: Yusuf Oskay Dağlı: conceptualisation, data collection, methodology, software, analysis, visualisation, writing (original draft) and project administration. Ebru Özpolat: statistical validation, methods review and editing.
Competing interests: The authors are co-founders of MetalTakip, which publishes market data and research on precious metals, metals and energy. Ebru Özpolat is also Risk Director at a cryptocurrency exchange, which had no role in this study. The study received no external funding. The report is for information only and is not investment advice.
Audit: The satellite analyses (radar and gas flares) were reproduced from the code and data by ChatGPT (OpenAI) in three rounds; Claude (Anthropic) checked each finding against the data and Ebru Özpolat reviewed the audits. The cloud and coverage check was added after these rounds; the comparison of the two closures and the Basra test were audited and corrected in a fourth, narrower round; after a closing check before publication, the interpretation of the Basra comparison was rewritten. That round did not independently reproduce the raw radar counts or the licensed Dated-ICE series, and the PortWatch port data and news reports on Basra were added after it. The price, gold, metals, Turkey and scenario chapters were outside these rounds.
Get the report and read the working paper
55 pages, 41 figures: the full PDF with the satellite and news data, Turkey's exposure map and the monitoring dashboard, sent to your inbox.